
 Facebook
 X
X
 Pinterest
 Copy Link
South King County Quarterly Market Trends – Q2 2019
South King County Quarterly Market Trends – Q2 2019
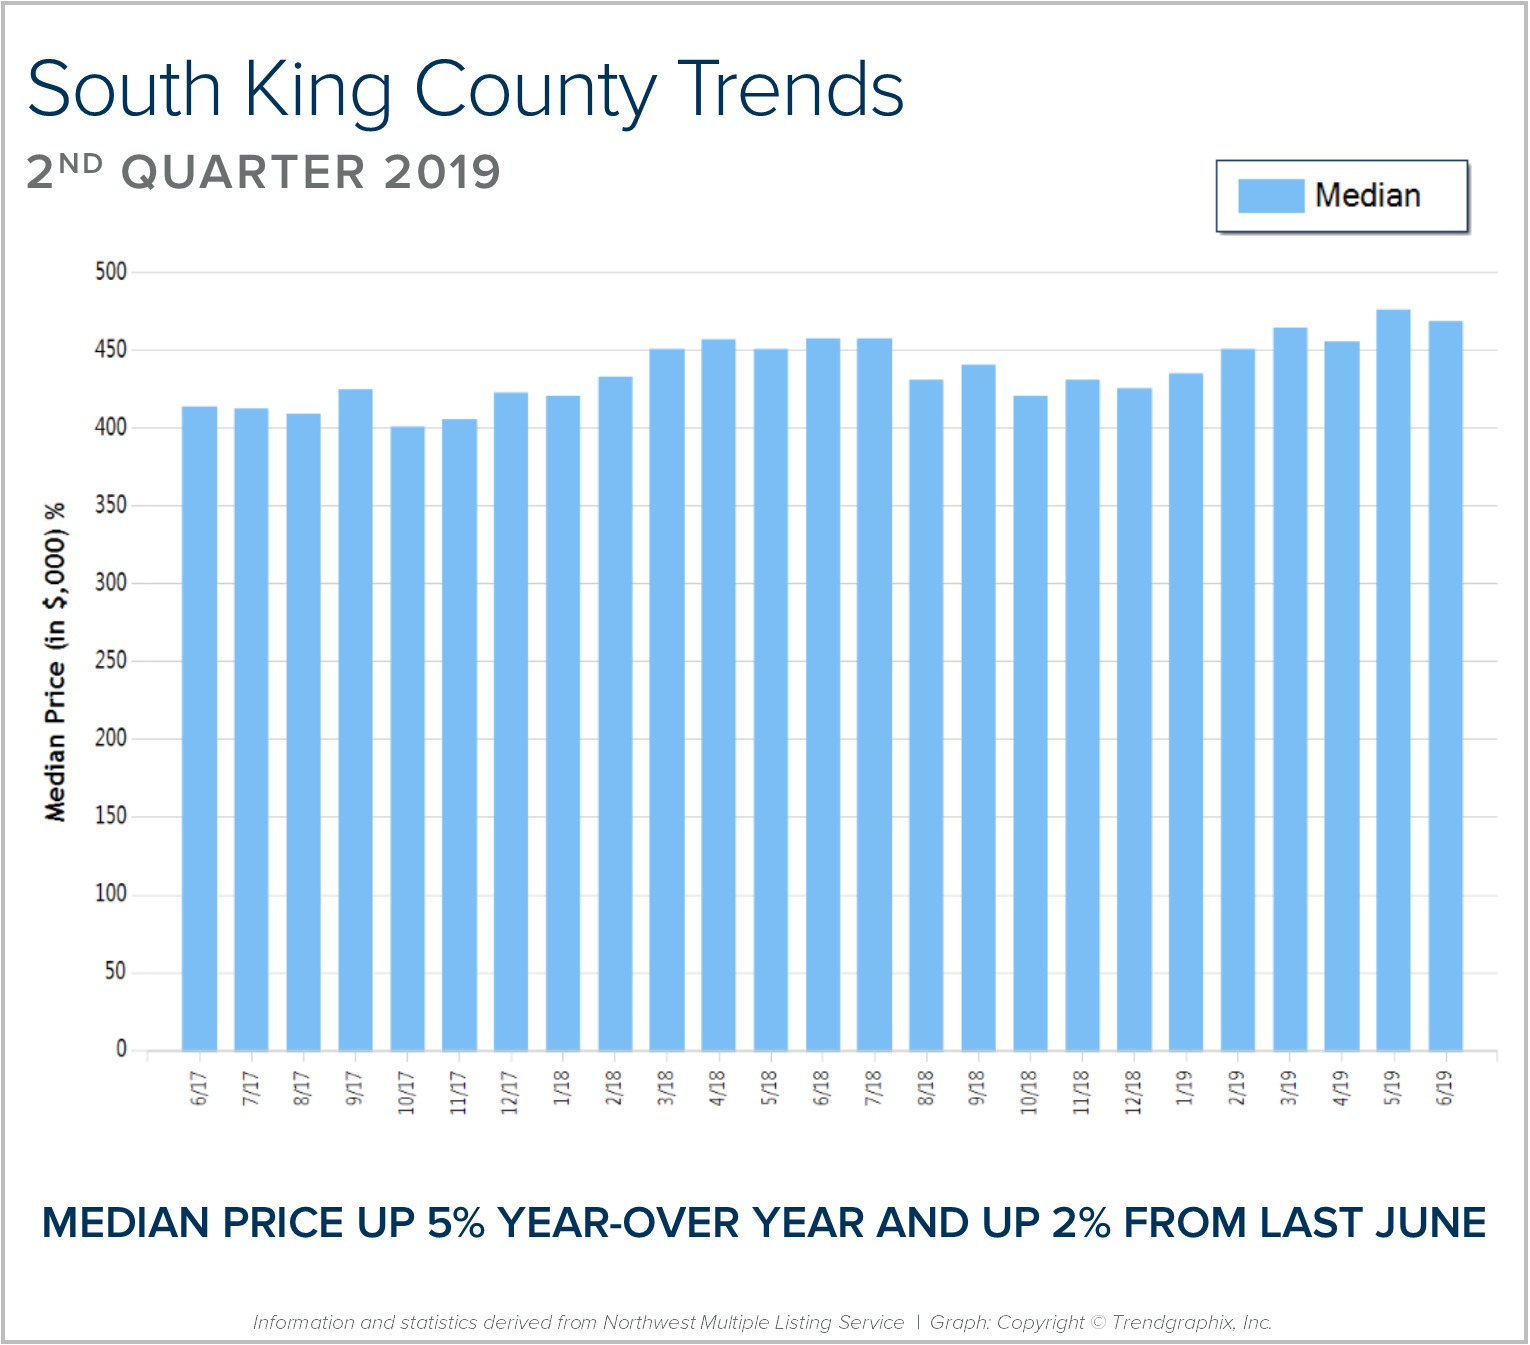
2019 provided a very healthy and more balanced spring market! Median price is up 5% complete year-over-year and up 2% from last June. Prices have started to find their balance as more inventory has come to market compared to the scarcity of years past. While buyers have had more choices over the last year, it is still a seller’s market with just 1.3 months of inventory based on pending sales, resulting in an average of 28 days on market and 99% list-to-sale price ratio in June. Low interest rates continue to drive demand, however sellers who overprice or don’t address condition issues will linger on the market.
Our real estate market continues to be driven by low interest rates, positive job creation, and upbeat consumer sentiment. Currently, interest rates sit around 4% which is still an historical low, affording buyers the ability to make moves and reduce their debt service. Price appreciation has started to temper to more normal rates, compared to the double-digit appreciation we experienced over the last 3 years due to more sellers coming to market. This has created more balance and greater opportunity for buyers. The generational shift we are experiencing as Baby Boomers move towards retirement and Millennials enter into their prime earning years is an exciting exchange happening in the market place right now.
This is only a snapshot of the trends in south King County; please contact me if you would like further explanation of how the latest trends relate to you.

Eastside Quarterly Market Trends – Q2 2019
Eastside Quarterly Market Trends – Q2 2019
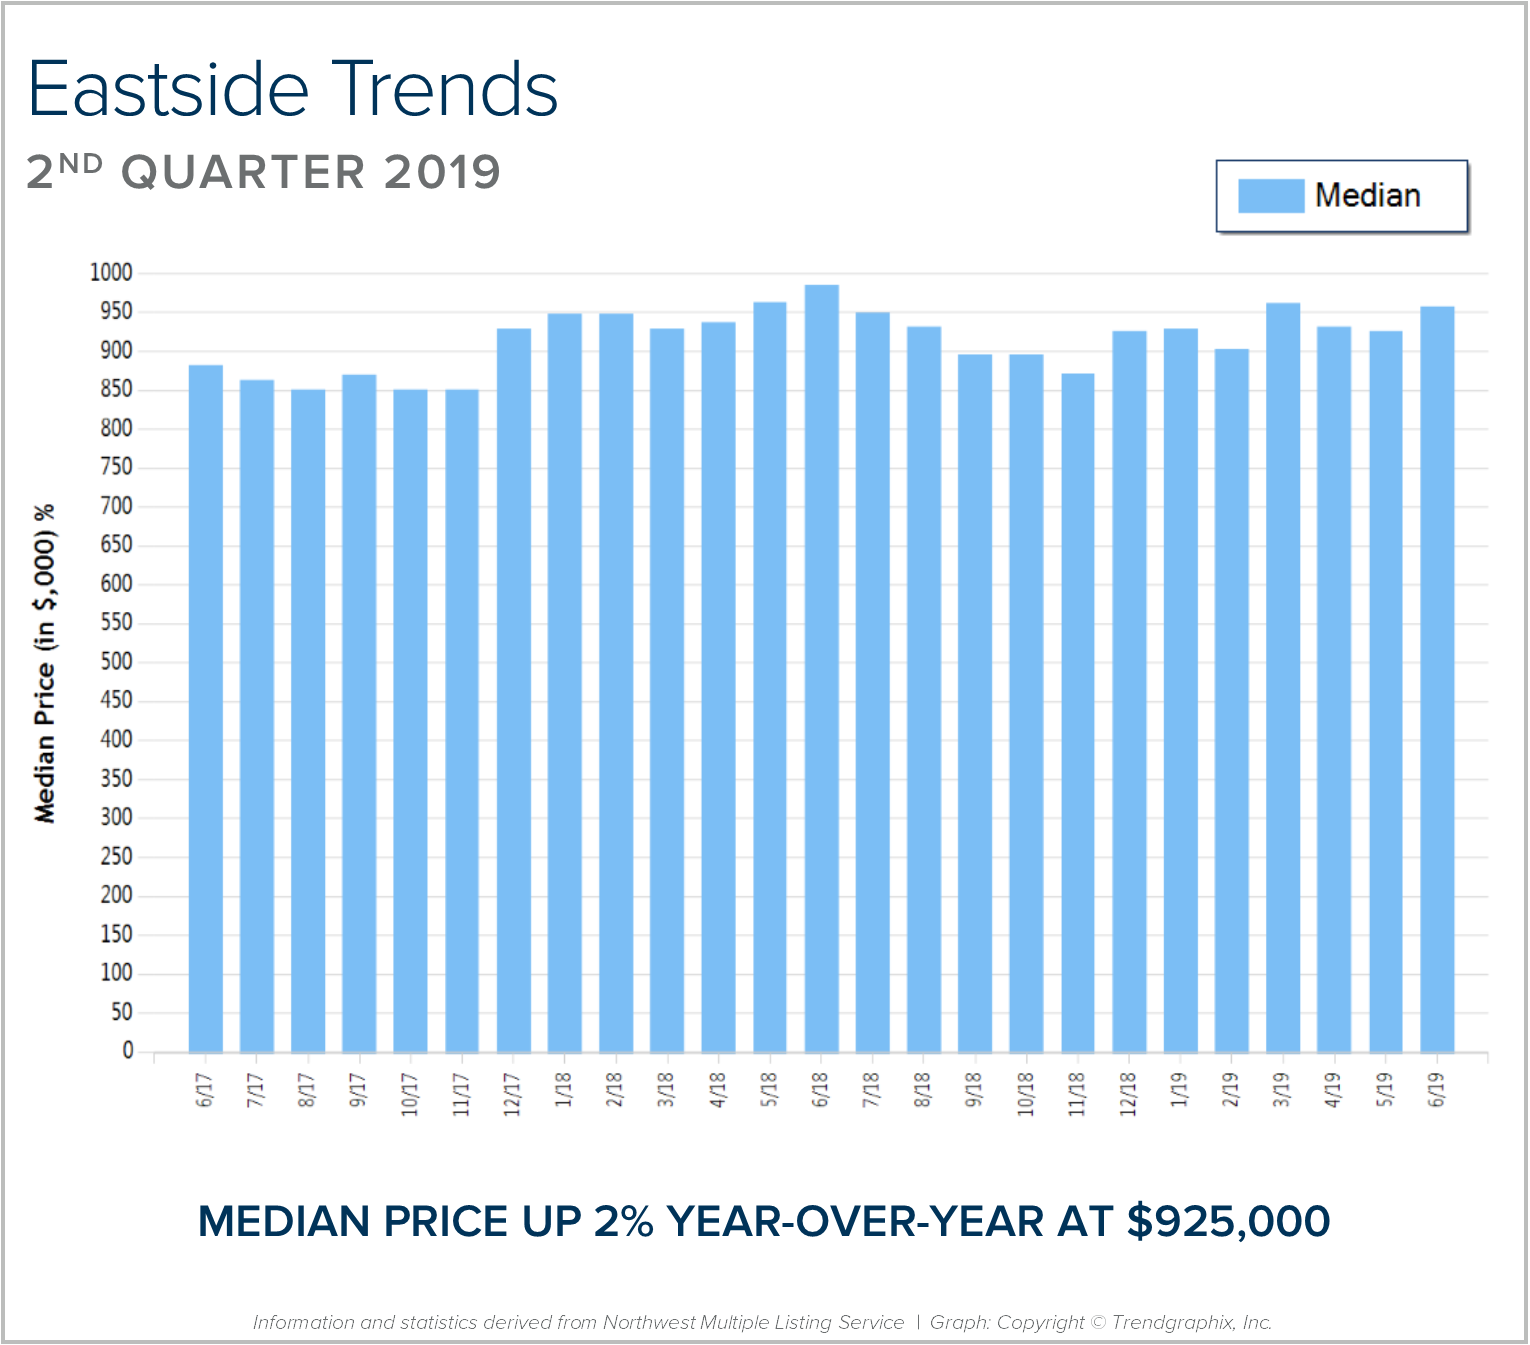
2019 provided a very healthy and more balanced spring market! Median price is up 2% year-over-year at $925,000. Prices have started to find their balance as more inventory has come to market compared to the scarcity of years past. While buyers have had more choices over the last year, it is still a seller’s market with just 2 months of inventory based on pending sales, resulting in an average of 30 days on market and 98% list-to-sale price ratio in June. Low interest rates continue to drive demand, however sellers who overprice or don’t address condition issues will linger on the market, illustrated by the 27% increase in carryover inventory.
Our real estate market continues to be driven by low interest rates, positive job creation, and upbeat consumer sentiment. Currently, interest rates sit around 4% which is still an historical low, affording buyers the ability to make moves and reduce their debt service. Price appreciation has started to temper to more normal rates, compared to the double-digit appreciation we experienced over the last 3 years due to more sellers coming to market. This has created more balance and greater opportunity for buyers. The generational shift we are experiencing as Baby Boomers move towards retirement and Millennials enter into their prime earning years is an exciting exchange happening in the market place right now.
This is only a snapshot of the trends on the Eastside; please contact me if you would like further explanation of how the latest trends relate to you.

Seattle Metro Quarterly Market Trends – Q2 2019
Seattle Metro Quarterly Market Trends – Q2 2019
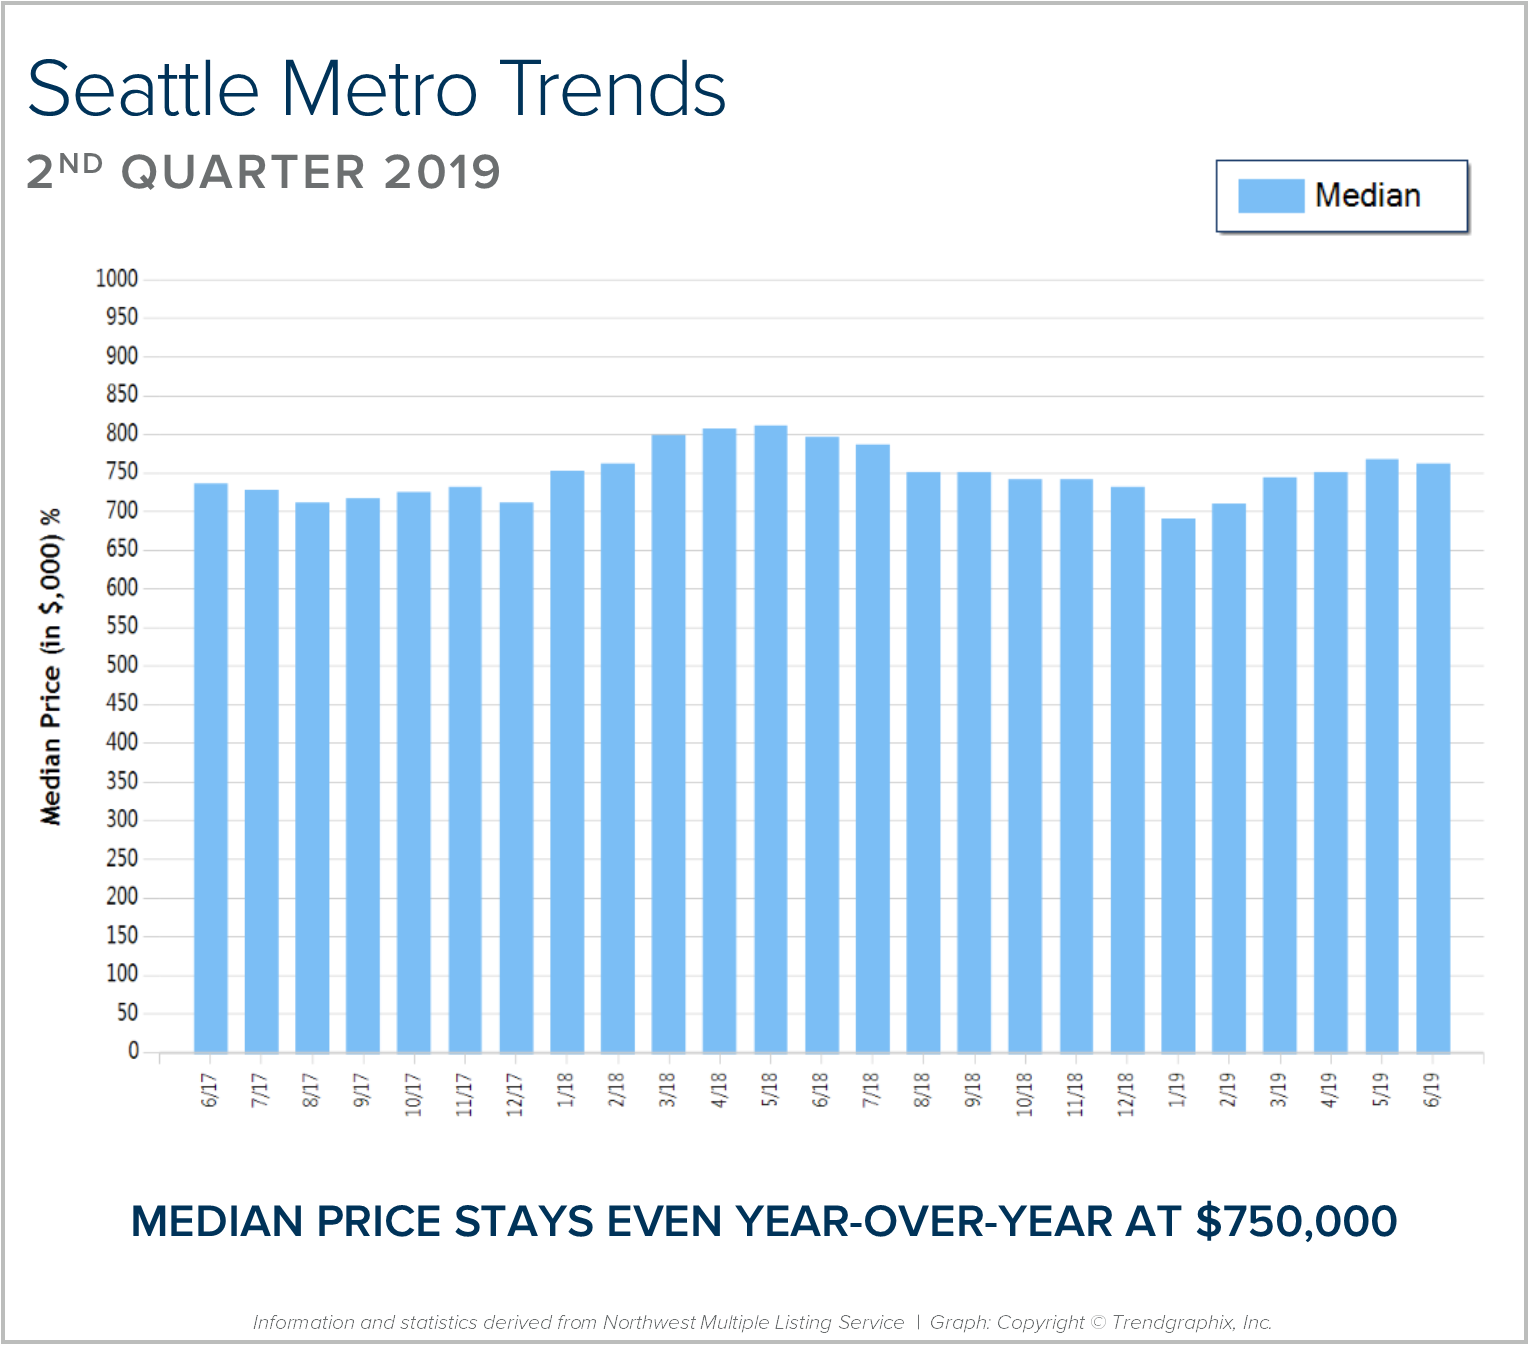
2019 provided a very healthy and more balanced spring market! Median price is even year-over-year at $750,000. Prices have started to find their balance as more inventory has come to market compared to the scarcity of years past. While buyers have had more choices over the last year, it is still a seller’s market with just 1.7 months of inventory based on pending sales, resulting in an average of 23 days on market and 99% list-to-sale price ratio in June. Low interest rates continue to drive demand, however sellers who overprice or don’t address condition issues will linger on the market, illustrated by the 66% increase in carryover inventory.
Our real estate market continues to be driven by low interest rates, positive job creation, and upbeat consumer sentiment. Currently, interest rates sit around 4% which is still an historical low, affording buyers the ability to make moves and reduce their debt service. Price appreciation has started to temper to more normal rates, compared to the double-digit appreciation we experienced over the last 3 years due to more sellers coming to market. This has created more balance and greater opportunity for buyers. The generational shift we are experiencing as Baby Boomers move towards retirement and Millennials enter into their prime earning years is an exciting exchange happening in the market place right now.
This is only a snapshot of the trends in the Seattle Metro area; please contact me if you would like further explanation of how the latest trends relate to you.

North King County Quarterly Market Trends – Q2 2019
North King County Quarterly Market Trends – Q2 2019
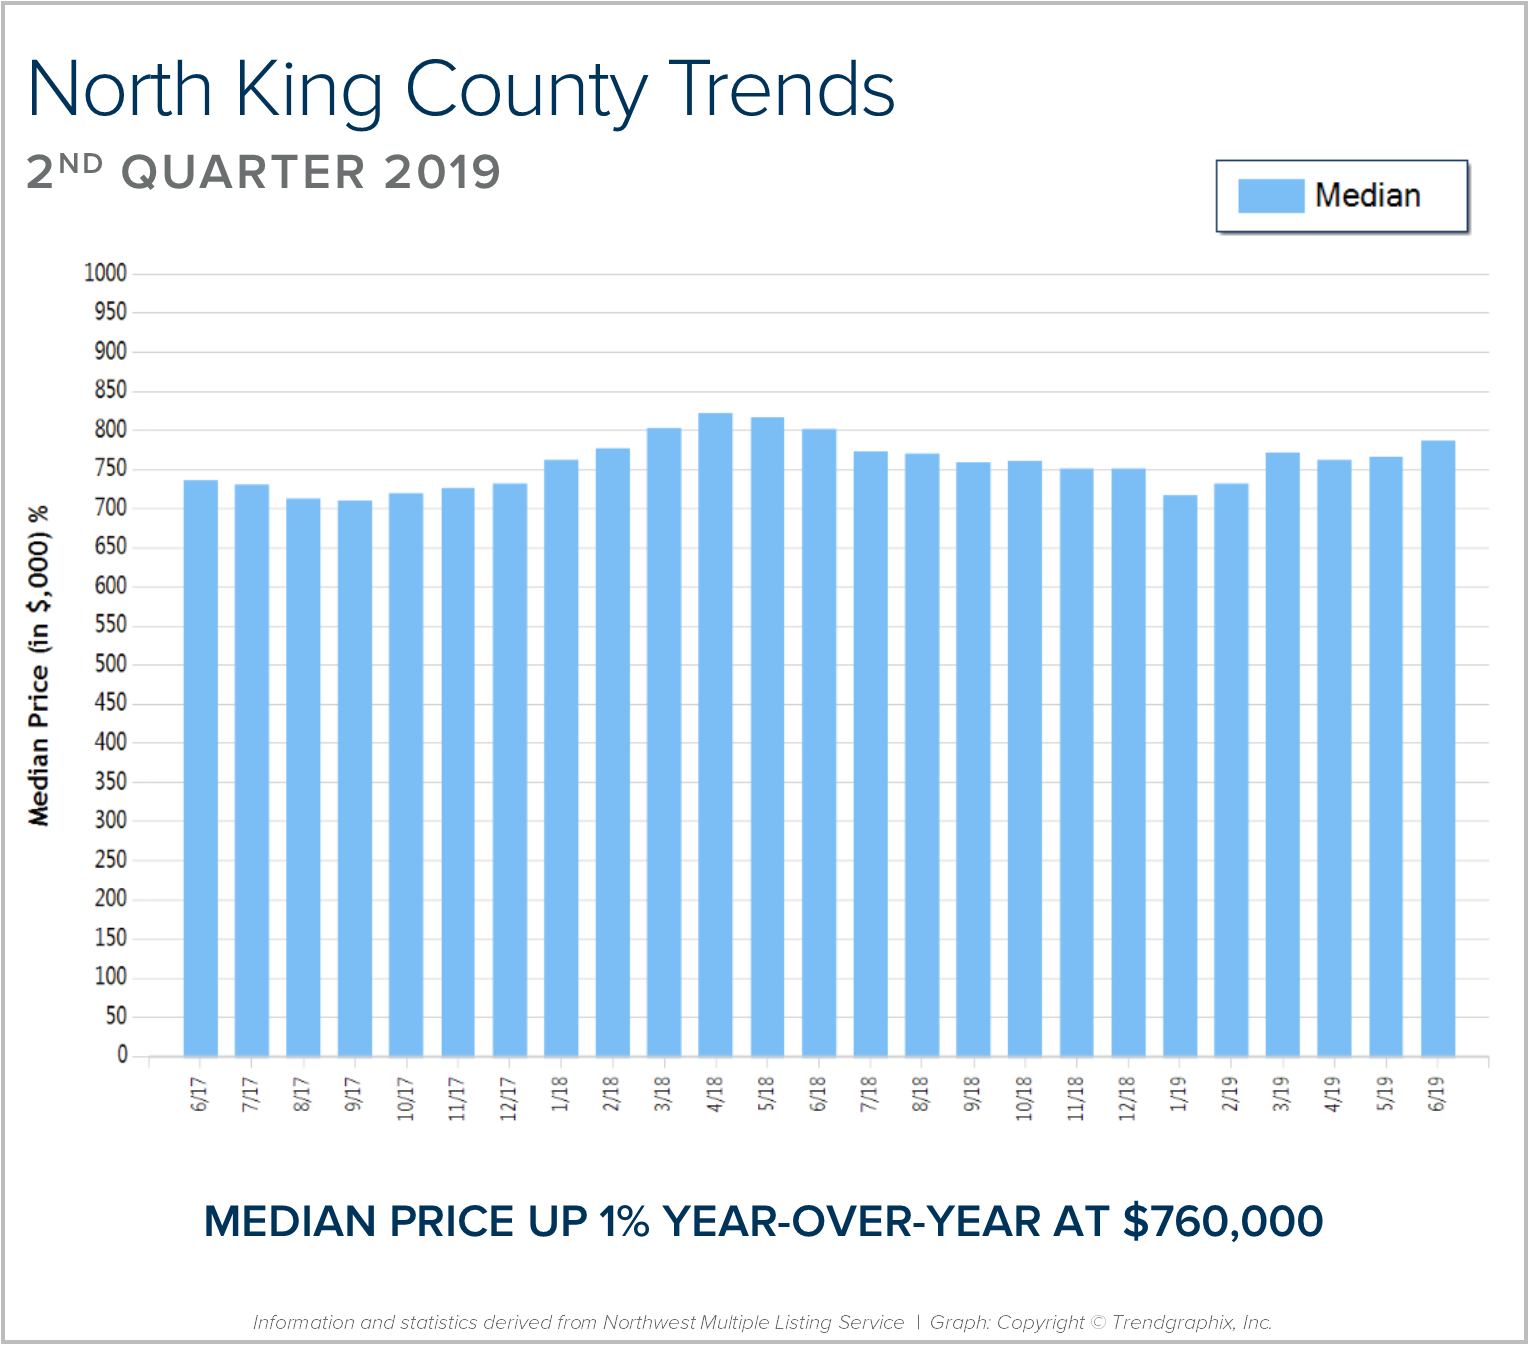
2019 provided a very healthy and more balanced spring market! Median price is up 1% year-over-year at $760,000. Prices have started to find their balance as more inventory has come to market compared to the scarcity of years past. While buyers have had more choices over the last year, it is still a seller’s market with just 1.6 months of inventory based on pending sales, resulting in an average of 23 days on market and 99% list-to-sale price ratio in June. Low interest rates continue to drive demand, however sellers who overprice or don’t address condition issues will linger on the market, illustrated by the 60% increase in carryover inventory.
Our real estate market continues to be driven by low interest rates, positive job creation, and upbeat consumer sentiment. Currently, interest rates sit around 4% which is still an historical low, affording buyers the ability to make moves and reduce their debt service. Price appreciation has started to temper to more normal rates, compared to the double-digit appreciation we experienced over the last 3 years due to more sellers coming to market. This has created more balance and greater opportunity for buyers. The generational shift we are experiencing as Baby Boomers move towards retirement and Millennials enter into their prime earning years is an exciting exchange happening in the market place right now.
This is only a snapshot of the trends in north King County; please contact me if you would like further explanation of how the latest trends relate to you.

South Snohomish County Quarterly Market Trends – Q2 2019
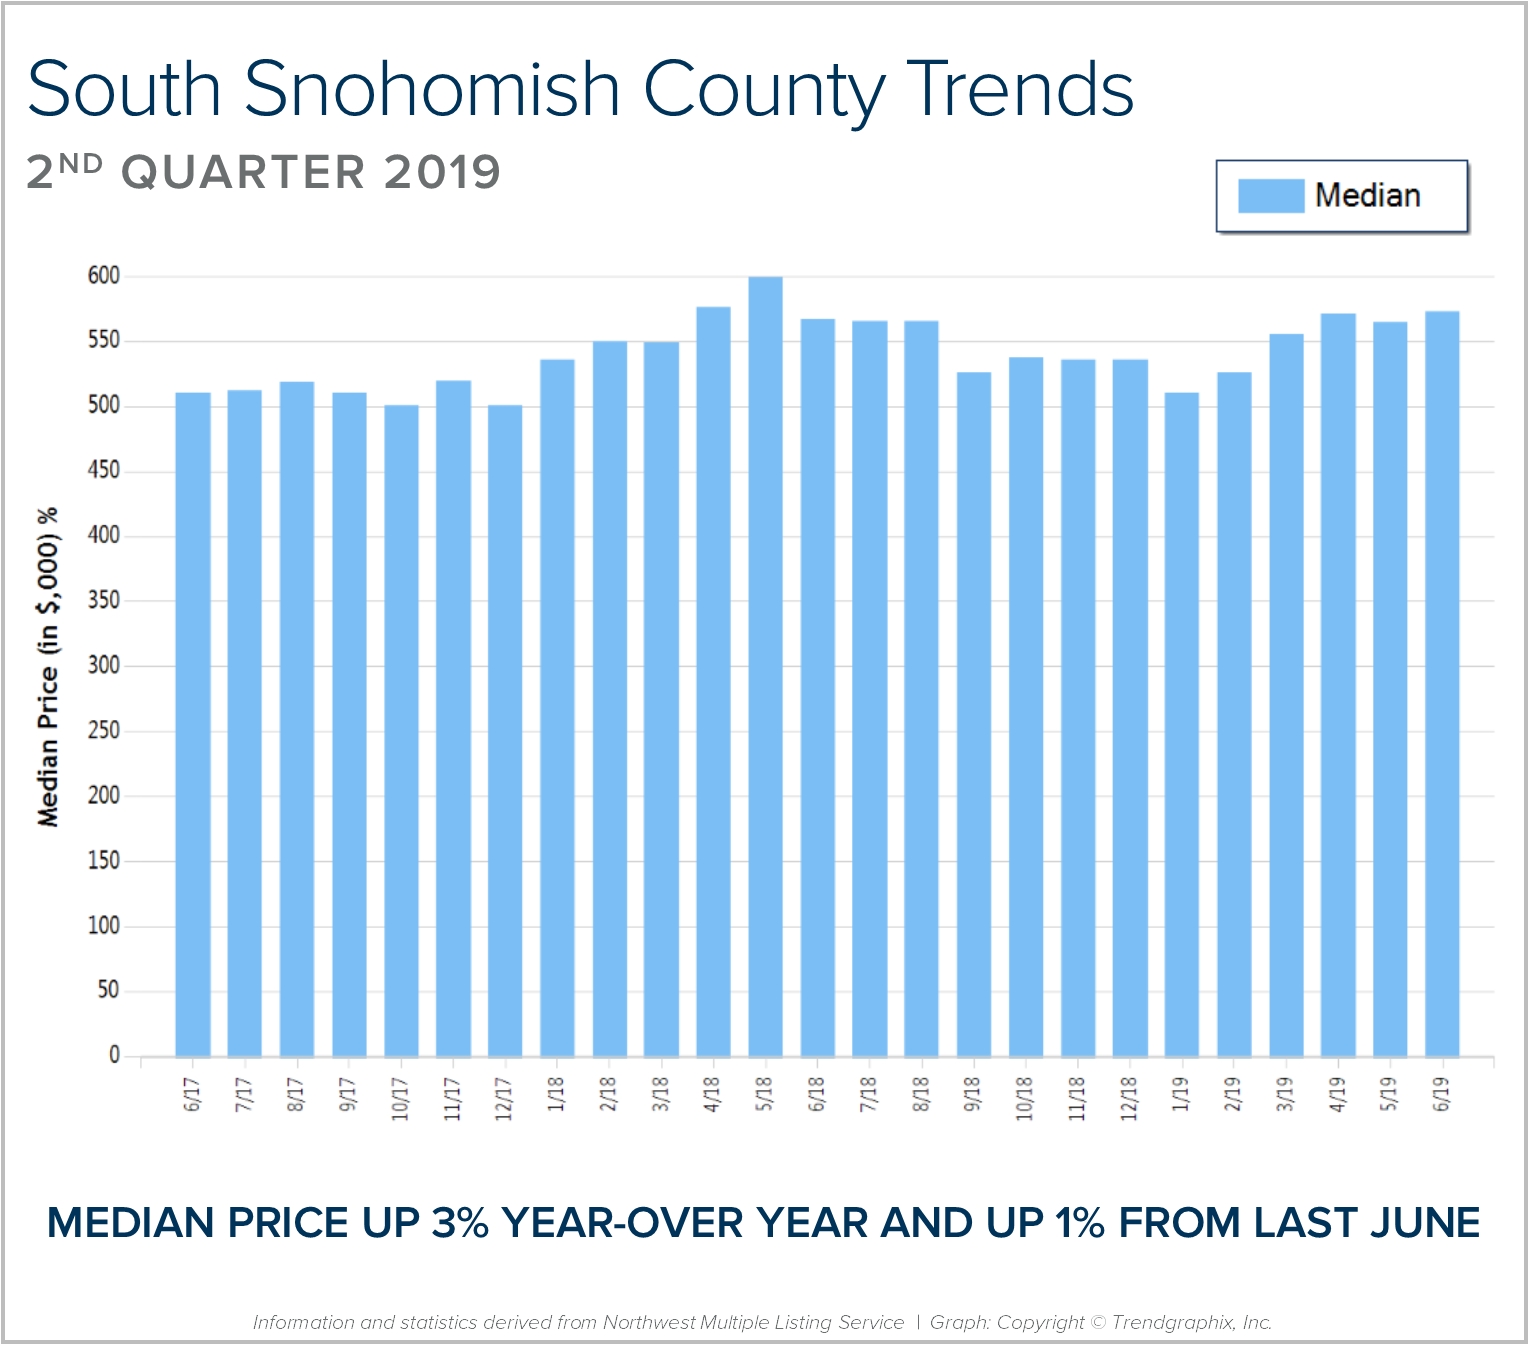
South Snohomish County Quarterly Market Trends – Q2 2019
2019 provided a very healthy and more balanced spring market! Median price is up 3% complete year-over-year and up 1% from last June. Prices have started to find their balance as more inventory has come to market compared to the scarcity of years past. While buyers have had more choices over the last year, it is still a seller’s market with just 1.5 months of inventory based on pending sales, resulting in an average of 21 days on market and 99% list-to-sale price ratio in June. Low interest rates continue to drive demand, however sellers who overprice or don’t address condition issues will linger on the market, which is illustrated by the 16% increase in carryover inventory year-over-year.
Our real estate market continues to be driven by low interest rates, positive job creation, and upbeat consumer sentiment. Currently, interest rates sit around 4% which is still an historical low, affording buyers the ability to make moves and reduce their debt service. Price appreciation has started to temper to more normal rates, compared to the double-digit appreciation we experienced over the last 3 years due to more sellers coming to market. This has created more balance and greater opportunity for buyers. The generational shift we are experiencing as Baby Boomers move towards retirement and Millennials enter into their prime earning years is an exciting exchange happening in the market place right now.
This is only a snapshot of the trends in south Snohomish County; please contact me if you would like further explanation of how the latest trends relate to you.

North Snohomish County Quarterly Market Trends – Q2 2019
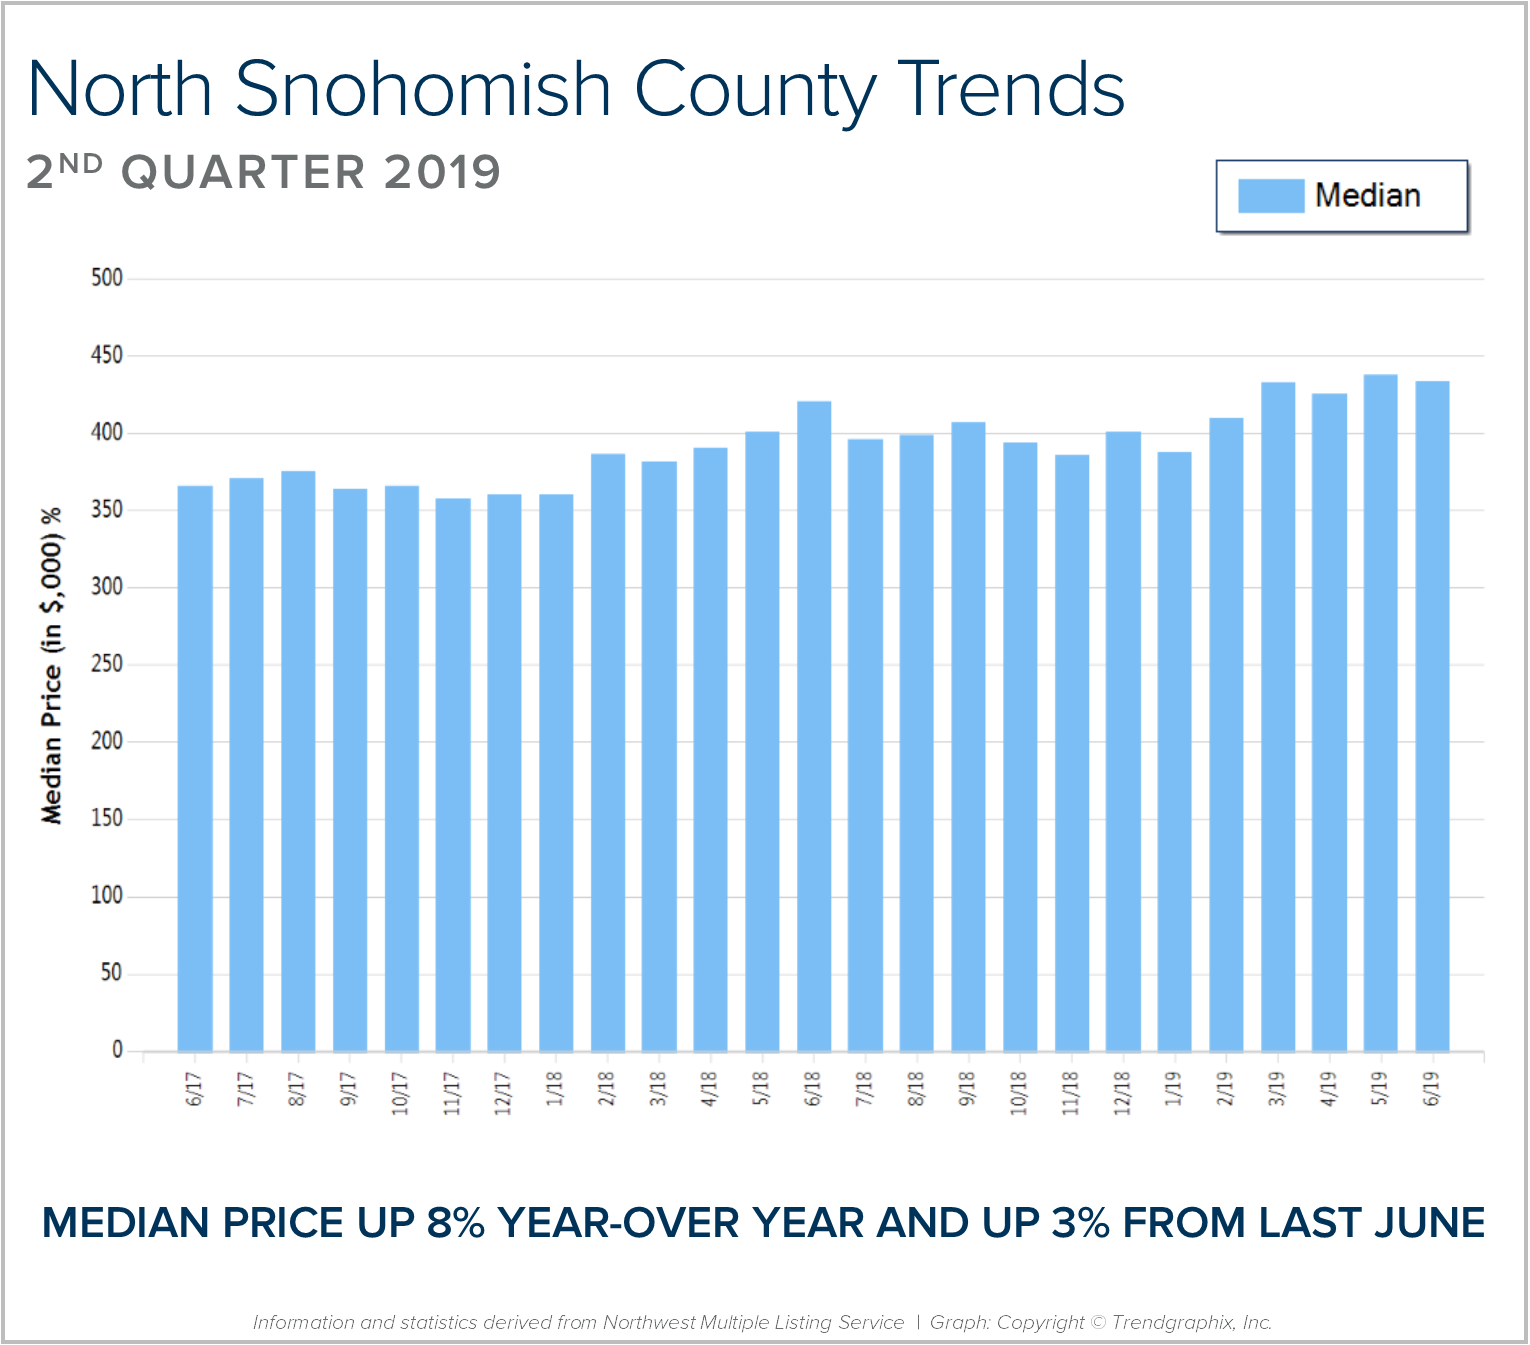
North Snohomish County Quarterly Market Trends – Q2 2019
2019 provided a very healthy and more balanced spring market! Median price is up 8% complete year-over-year and up 3% from last June. Prices have started to find their balance as more inventory has come to market compared to the scarcity of years past. While buyers have had more choices over the last year, it is still a seller’s market with just 1.3 months of inventory based on pending sales, resulting in an average of 23 days on market and 100% list-to-sale price ratio in June. Low interest rates continue to drive demand, however sellers who overprice or don’t address condition issues will linger on the market, which is illustrated by the 15% increase in carryover inventory year-over-year.
Our real estate market continues to be driven by low interest rates, positive job creation, and upbeat consumer sentiment. Currently, interest rates sit around 4% which is still an historical low, affording buyers the ability to make moves and reduce their debt service. Price appreciation has started to temper to more normal rates, compared to the double-digit appreciation we experienced over the last 3 years due to more sellers coming to market. This has created more balance and greater opportunity for buyers. The generational shift we are experiencing as Baby Boomers move towards retirement and Millennials enter into their prime earning years is an exciting exchange happening in the market place right now.
This is only a snapshot of the trends in north Snohomish County; please contact me if you would like further explanation of how the latest trends relate to you.

Outdoor Movie Schedule – Summer 2019
SOUTH SNOHOMISH
Arlington’s Movies @ Olympic Theater
Olympic Theater
- 6/21 The Lego 2 Movie
- 7/19 Spider Man: Into the Spider-Verse
- 8/2 Dumbo
Frances Anderson Center Field
- 7/26 Trolls
- 8/2 A Wrinkle in Time
Everett’s Cinema Under the Stars
Thornton Sullivan Park, Camp Patterson Field
- 7/19 Incredibles 2
- 7/26 Ralph Breaks the Internet
- 8/2 The Lego Movie 2
- 8/9 Spider Man: Into the Spider-Verse
- 8/16 How to Train Your Dragon: The Hidden World
Port of Everett North Guest Docks 6 & 7 (by boat) or Boxcar Park (by land)
- 7/19 Battleship
- 7/26 Transformers
- 8/2 Remember the Titans
- 8/9 Pirates of the Caribbean
- 8/16 The Proposal
- 8/23 Moana
Marysville Popcorn in the Park
Jennings Park
- 7/13 A Dog’s Way Home
- 7/20 Ralph Breaks the Internet
- 7/27 Bumblebee
- 8/3 Incredibles 2
- 8/10 The Karate Kid
Lake Tye Park
- 8/2 The Incredibles 2
- 8/9 Ralph Breaks the Internet
- 8/16 Mary Poppins Returns
- 8/23 Black Panther
Willis Tucker Park (Snohomish)
- 7/25 The Incredibles 2
- 8/1 How to Train Your Dragon: The Hidden World
Lake Stevens Community Park
- 8/8 Jurassic World: Fallen Kingdom
- 8/15 Mary Poppins Returns
EASTSIDE
Downtown Park
- 7/9 Hotel Transylvania 3
- 7/16 A Dog’s Way Home
- 7/23 Smallfoot
- 7/30 How to Train Your Dragon: The Hidden World
- 8/6 The Lego Movie 2
- 8/13 Ferdinand
- 8/20 Wonder Park
- 8/27 Back to the Future
Crossroads Park
- 8/1 Christopher Robin
- 8/8 Ralph Breaks the Internet
- 8/15 The Incredibles 2
- 8/22 Mary Poppins Returns
Carillon Point Plaza
- 7/6 Mean Girls
- 7/20 Crazy Rich Asians
- 8/3 The Incredibles 2
- 8/17 Solo: A Star Wars Story
Marymoor Park
- 7/10 Ferris Bueller’s Day Off
- 7/17 Bohemian Rhapsody
- 7/24 Spider Man: Into the Spider-Verse
- 7/31 Top Gun
- 8/7 The Incredibles 2
- 8/13 The Sandlot
- 8/22 Grease
- 8/28 The Princess Bride
SEATTLE
Seattle Center Mural Amphitheatre
- 7/19 Wayne’s World
Columbia Park
- 7/20 Spider Man: Into the Spider-Verse
- 8/17 The Lego Movie 2
International District Summer Cinema
Hing Hay Park
- 8/3 Crazy Rich Asians
- 8/10 Iron Monkey
- 8/17 Mirai
- 8/24 Up
Seattle Center Mural Amphitheatre
- 7/27 The Princess Bride
- 8/3 Crazy Rich Asians
- 8/10 Bohemian Rhapsody
- 8/17 Dirty Dancing
- 8/24 Black Panther
Outdoor Movie Nights @ Peddler Brewing
Peddler Brewing Co Beer Garden
- 5/30 The Goonies
- 6/6 Bridesmaids
- 6/13 Super Troopers
- 6/20 Indiana Jones: Raiders of the Lost Ark
- 6/27 Mean Girls
- 7/11 The Hangover
- 7/18 The Princess Bride
- 7/25 10 Things I Hate About You
- 8/1 Back to the Future
- 8/8 Point Break
- 8/15 Pitch Perfect
- 8/22 The Sandlot
- 8/29 The Big Lebowski
South Lake Union Discovery Center (21+)
- 6/22 The Matrix: 20th Anniversary
- 7/20 Bill & Ted’s Excellent Adventure: 30th Anniversary
- 8/17 The Life Aquatic
Skyway Outdoor Cinema
- 8/2 Incredibles 2
- 8/9 The Princess Bride
- 8/16 Aquaman
- 8/23 Spider Man: Into the Spider-Verse
Campership Drive

Sending Kids to Summer Camp
Every year, our office comes together to provide summer camp scholarships for local kids who may not otherwise have the opportunity to experience the adventures of overnight camp. We partner with YMCA Camp Orkila and Camp Colman; local programs dedicated to nurturing the potential of youth, promoting healthy living, and fostering social responsibility.
This year, we collectively donated $16,125 for these camp scholarships. With a Windermere Foundation match of $1,000, our 2019 total of $17,125 is our highest number ever! But that wasn’t the end. An anonymous YMCA donor matched an additional $4,338, bringing us to $21,463 – Wow!
Overall, since 1994, we are responsible for $186,918 in summer camp scholarships for local kids who may be homeless, in transitional living shelters, living through family crisis, or existing within economic means that does not allow them the opportunity to experience the adventures of summer camp that other kids do. We are so proud to be part of an office that cares so deeply for the community!

Western Washington Real Estate Market Update 2019 Q1
Western Washington Real Estate Market Update
Posted in Western Washington Real Estate Market Update by Matthew Gardner, Chief Economist, Windermere Real Estate

The following analysis of the Western Washington real estate market is provided by Windermere Real Estate Chief Economist Matthew Gardner. We hope that this information may assist you with making better-informed real estate decisions. For further information about the housing market in your area, please don’t hesitate to contact your Windermere agent.
ECONOMIC OVERVIEW
Washington State employment slowed to an annual growth rate of 1.7% — a level not seen since 2012 — and continues a trend of slowing that started in the summer of 2018. I was a little surprised to see such a significant drop in employment growth, but it may be due to the state re-benchmarking their data (which they do annually). As such, I am not overly concerned about the lower-than-expected numbers but will be watching to see if this trend continues as we move through the spring months. The state unemployment rate was 4.5%, marginally below the 4.6% level a year ago.
My latest economic forecast suggests that statewide job growth in 2019 will be positive but is expected to slow. We should see an additional 84,000 new jobs, which would be a year-over-year increase of 2.2%.
HOME SALES
- There were 13,292 home sales during the first quarter of 2019. Year-over-year, sales were down 12.3% and were 23.4% lower than the fourth quarter of 2018.
- It is quite likely that part of the slowdown can be attributed to the very poor weather in February. That said, anecdotal information from our brokers suggests that March was a very active month and I expect to see sales rise again through the spring selling season. Notably, pending home sales were only off by 3.5% from the first quarter of 2018.
- All counties contained in this report saw sales drop when compared to a year ago. The greatest drops were in the relatively small counties of San Juan, Clallam, Island, and Kitsap.
- The decline in interest rates during the first two months of the quarter nudged many home buyers off the fence. I believe this will cause a significant bump in sales activity in the second quarter numbers.

HOME PRICES
 In combination with the factors discussed earlier, the 40% increase in listings has caused home price growth to taper to a year-over-year increase of 3.3%.
- Home prices were higher in every county except Clallam. While the growth of prices is slowing, the strong local economy, combined with lower interest rates, will cause home prices to continue rising through 2019.
- When compared to the same period a year ago, price growth was strongest in San Juan County, where home prices were up 36.4%. Only one other county experienced a double-digit price increase.
- As I have said for quite some time now, there must always be a relationship between incomes and home prices, and many areas around Western Washington are testing this ceiling. That said, the region’s economy continues to perform well and incomes are rising, which, in concert with low interest rates, will allow prices to continue to rise but at a significantly slower pace.

DAYS ON MARKET
- The average number of days it took to sell a home matched the same quarter of 2018.
- Pierce County was the tightest market in Western Washington, with homes taking an average of 40 days to sell. There were seven counties that saw the length of time it took to sell a home drop compared to the same period a year ago. Market time rose in seven counties and one was unchanged.
- Across the entire region, it took an average of 61 days to sell a home in the first quarter of 2019. This matches the level seen a year ago but is up by 10 days when compared to the fourth quarter of 2018.
- In the last two Gardner Reports, I suggested that we should be prepared for days-on-market to increase, and that is now occurring. Given projected increases in inventory, this trend will continue, but this is typical of a regional market that is moving back toward balance.

CONCLUSIONS
 This speedometer reflects the state of the region’s real estate market using housing inventory, price gains, home sales, interest rates, and larger economic factors. I am again moving the needle toward buyers as price growth moderates and listing inventory continues to rise.
I do not see any clouds on the horizon that suggest we will see a downturn in sales activity in 2019. That said, this will be the year we move closer to balance. Buyers who were sidelined by the significant increase in listings in the second half of 2018 are starting to get off the fence as mortgage rates drop. I foresee a buoyant spring market ahead.
 As Chief Economist for Windermere Real Estate, Matthew Gardner is responsible for analyzing and interpreting economic data and its impact on the real estate market on both a local and national level. Matthew has over 30 years of professional experience both in the U.S. and U.K.
In addition to his day-to-day responsibilities, Matthew sits on the Washington State Governors Council of Economic Advisors; chairs the Board of Trustees at the Washington Center for Real Estate Research at the University of Washington; and is an Advisory Board Member at the Runstad Center for Real Estate Studies at the University of Washington where he also lectures in real estate economics.
2019 Farmer’s Markets Schedules


When you shop at a local Farmers Market, you’re buying outstanding freshness, quality and flavor. Knowing exactly where your food comes from and how it was grown provides peace of mind for your family. Plus, you’re supporting a sustainable regional food system that helps small family farms stay in business; protects land from over-development, and provides the community with fresh, healthy food. Find one near you on the list below!
SOUTH SNOHOMISH:
Arlington Farmers Market
Legion Park: 200 N. Olympic Ave
Saturdays. 10am-3pm
June 1 — August 31
Bothell Park Ridge Community Market
Park Ridge Church: 3805 Maltby Road, Bothell
Wednesdays 4pm-8pm
June 5—September 25
Edmonds Garden Market
Historical Museum: 5th & Bell Street
Saturdays 9am-2pm
May 4—June 8
Edmonds Summer Market
Downtown: 5th St from the fountain
Saturdays 9am-3pm
June 15—October 5
Everett Farmers Markets
Boxcar Park: 615 13th Street
Sundays 11am-4pm
May 12—October 6
Everett Transit Center: 2333 32nd St
Wednesdays 4pm-8pm
June 5—August 28
Marysville Farmer’s Market
Location TBD
Saturdays 10am-2pm
June 22—August 31
Mill Creek Farmer’s Market
City Hall: 15720 Main St.
Tuesdays 3pm-7pm
June 18-August 20
Snohomish Farmers Market
Cedar Ave & Pearl St.
Thursdays 3pm-7pm
May 2—September 26
EASTSIDE:
Bellevue Farmers Market
First Presbyterian: 1717 Bellevue Way NE
Thursdays 3pm-7pm
May 16—October 10
Bellevue Crossroads Farmers Market
East Parking Lot: 15600 NE 8th St
Tuesdays 12pm-6pm
June 4—September 24
Issaquah Farmers Market
Pickering Barn: 1730 10th Ave NW
Saturdays 9am-2pm
May 4—September 28
Juanita Friday Market
Juanita Beach: 9703 NE Juanita Dr
Fridays 3pm-7pm
June 5—September 27
Kirkland Wednesday Market
Marina Park: 25 Lakeshore Plaza
Wednesdays 2pm-7pm
June 7—September 25
Mercer Island Farmers Market
Mercerdale Park: 7700 SE 32nd St
Sundays 10am-3pm
June 2—September 29
Redmond Saturday Market
Redmond Town Center: 7730 Leary Way NE
Saturdays 9am-3pm
May 4—October 26
Sammamish Farmers Market
City Hall Plaza: 801 228th Ave SE
Wednesdays 4pm-8pm
May 8—September 18
Woodinville Farmers Market
DeYoung Park: 13680 NE 175th St
Saturdays 9am-3pm
May 4—September 28
SEATTLE:
Ballard Farmers Market
Ballard Ave NW
Sundays. 10am-3pm
YEAR ROUND
Capitol Hill Broadway Farmers Market
Seattle Central Comm College: Broadway & Pine
Sundays 11am-3pm
YEAR ROUND
Columbia City Farmers Market
37th Ave S & S Edmunds St
Wednesdays 3pm-7pm
May 8—October 9
Fremont Sunday Market
Corner of 3410 Evanston Ave N
Sundays 10am-4pm
YEAR ROUND
Lake City Farmers Market
125th St and 28th Ave NE
Thursdays 3pm-7pm
June 6—October 3
Lake Forest Park Farmers Market
Third Place Commons: 17171 Bothell Way NE
Sundays 10am-3pm
May 12—October 20
Madrona Farmers Market
1126 Martin Luther King Jr. Way
Fridays 3pm-7pm
May 17—October 11
Magnolia Farmers Market
Magnolia Village: 33rd Ave W & W McGraw
Saturdays. 10am-2pm
June 1—November 23
Phinney Farmers Market
Neighborhood Center: Phinney Ave N
Fridays 3:30pm-7:30pm
June 7—September 27
Pike Place Farmers Market
Pike Place & Pine St
Saturdays 9am-5pm
June 1—November 23
Queen Anne Farmers Market
W Crockett Street & Queen Anne Ave N
Thursdays 3pm-7:30pm
May 30—October 10
Shoreline Farmers Market
15300 Westminster Ave N
Saturdays 10am-3pm
June 8—October 5
University District Farmers Market
University Way NE “the Ave”
Saturdays 9am-2pm
YEAR ROUND
Wallingford Farmers Market
Meridian Park: Meridian Ave N & N 50th St
Wednesdays 3pm-7pm
May 15—September 25
West Seattle Farmers Market
California Ave SW & SW Alaska St
Sundays 10am-2pm
YEAR ROUND
You can also search for farmers markets in other counties here.
Before planning your visit, be sure to check market websites for possible holiday or weather closures and special events.
